Invariance of the Response Processes Between Gender and Modes in an Assessment of Reading
 Ulf Kroehne
 Carolin Hahnel
 Frank Goldhammer
- 1DIPF | Leibniz Institute for Research and Information in Education, Frankfurt am Main, Germany
- 2Centre for International Student Assessment (ZIB), Frankfurt am Main, Germany
In this paper, we developed a method to extract item-level response times from log data that are available in computer-based assessments (CBA) and paper-based assessments (PBA) with digital pens. Based on response times that were extracted using only time differences between responses, we used the bivariate generalized linear IRT model framework (B-GLIRT, [1]) to investigate response times as indicators for response processes. A parameterization that includes an interaction between the latent speed factor and the latent ability factor in the cross-relation function was found to fit the data best in CBA and PBA. Data were collected with a within-subject design in a national add-on study to PISA 2012 administering two clusters of PISA 2009 reading units. After investigating the invariance of the measurement models for ability and speed between boys and girls, we found the expected gender effect in reading ability to coincide with a gender effect in speed in CBA. Taking this result as indication for the validity of the time measures extracted from time differences between responses, we analyzed the PBA data and found the same gender effects for ability and speed. Analyzing PBA and CBA data together we identified the ability mode effect as the latent difference between reading measured in CBA and PBA. Similar to the gender effect the mode effect in ability was observed together with a difference in the latent speed between modes. However, while the relationship between speed and ability is identical for boys and girls we found hints for mode differences in the estimated parameters of the cross-relation function used in the B-GLIRT model.
Invariance of the Response Processes between Gender and Modes in an Assessment of Reading
Technology-based assessments offer the possibility to collect additional log data, including response times as the amount of time test-takers spend responding to particular questions or tasks. Primarily, response times provide information about test-takers' speed, which—if not considered—might confound comparisons of test-takers' ability [2] due to inter-individual differences in the speed-ability compromise [3]. Response times can allow inferences about response processes [4, 5]. Although at the individual level response times are influenced by multiple factors [6], the comparison of characteristics at the group level, such as the between-person relationship of speed and ability (e.g., [7]), can provide information about the comparability of underlying processes. Yet, response times and the relationship between speed and ability might also be considered as criteria for a comparison of response processes between test administrations with different properties [8]. Such mode effect studies often focus on the degree of measurement invariance (e.g., [9]), typically excluding effects of between-person characteristics, such as gender, either as differential item functioning (DIF, e.g., [10]) or ability difference at the population level (e.g., [11, 12]).
Research on mode effects and gender differences both consider mainly comparisons concerning the correctness of responses (response accuracy). Time-related criteria, such as the number of not reached items or response times at the item level, are rarely considered (see [13], for an exception) for the investigation of equivalence between modes or gender. Instead, as summarized by Kong et al. [14], reading speed is often analyzed for the comparison between modes.
Focusing on differences in the response accuracy requires that the underlying response processes are identical. However, the differences in reading comprehension found between computer-based assessment (CBA) and paper-based assessment (PBA, e.g., [15]), and boys and girls [e.g., [16]] might also be caused by construct-related differences such as reading strategies (e.g., [17]) between mode or gender. These differences might be associated with different test-taking processes in the assessments, resulting in a certain response behavior which allows investigating the relationship between speed and ability as characteristic of the response process.
Since PISA introduced CBA in 2015 [18], some authors have questioned the comparability of CBA and PBA in PISA, in particular, concerning trend estimates (e.g., [19, 20]). Although a detailed review of the current literature regarding mode effects is beyond the scope of this paper (see, e.g., [8]), we aim at providing a method for investigating response time differences between modes, which is currently missing. The potential benefit of a method that allows investigating speediness as an additional criterion of equivalence for mode effects is 2-fold: Allowing the removal of potential confounding of inter-individual differences in the speed-ability compromise concerning the comparability across modes and developing models for the explanation of mode effects beyond their simple quantification.
Comparing response processes regarding response times between modes requires the accessibility of response time measures at the item-level. While the availability of response times is often mentioned as one of the benefits of CBA (e.g., [21]), response times are metered only at an aggregate level in PBA (e.g., [22]). This lack of detailed time information from PBA instruments restrains the investigation of mode effects concerning time-related equivalence criteria and results in limited knowledge about the comparability of response processes between modes. The current study aims at filling this gap by using time measures collected with so-called digital pens in comparison to time measures extracted from log files of CBA test administration. Hence, gender differences which are well-known to exist concerning reading ability are investigated at first demonstrating the usefulness of the derived time measures for the comparison of response times of boys and girls in CBA and PBA separately. Afterward, the time measures are used to investigate mode effects assuming that the operationalization of the time measures is comparable between CBA and PBA. To summarize, we use B-GLIRT models, which are introduced in the next section, to investigate speed and ability using data from a technology-based assessment conducted as add-on study to PISA 2012 in Germany.
Modeling Response Times With the B-GLIRT Framework
Recent psychometric models incorporate response times in item response theory (IRT) models, either with a constant speed assumption (hierarchical modeling, e.g., [23]; bivariate generalized linear IRT, B-GLIRT, [1]) or without (e.g., [24]). In this paper, the B-GLIRT approach is focused, because this framework provides promising features: (i) it can be adapted to various relationships between responses and response times, (ii) it can be estimated with standard SEM software, and (iii) it can be applied to investigate measurement invariance [1]. The B-GLIRT model as shown in Figure 1 [1] models responses to dichotomous items using a linear model and a link function, known to result in the normal ogive version of the 2-parameter model
with a slope parameter αi and an intercept parameter βi for each item i. In addition to the responses Xpi, the response times Tpi are included in the B-GLIRT model, log-transformed, as factor model
with as the variance of the residual variables ωi. The intercepter parameter λi is the time intensity parameter for item i and a slope parameter φi as time discrimination relates the latent speed factor τp to the (log-) response time.
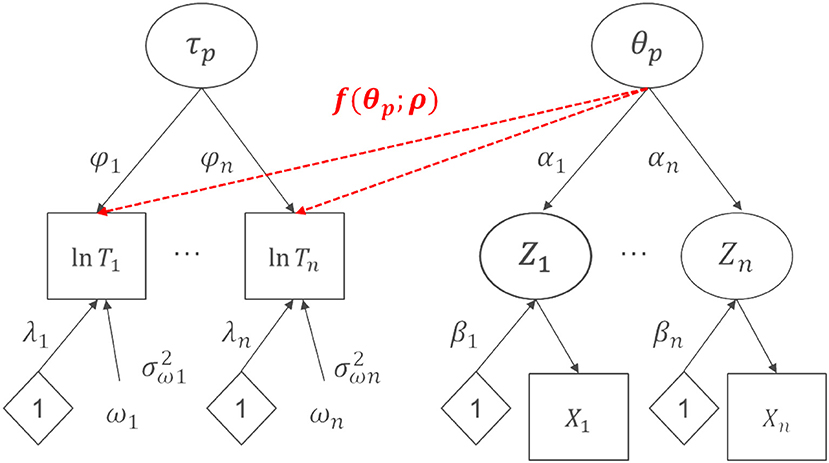
Figure 1. Schematic display of the B-GLIRT Model by Molenaar et al. [1] used to investigate measurement invariance.
The flexible nature of the B-GLIRT model comes into play when the cross-link function f(θp; ρ) is specified, allowing the estimation of models that are equivalent or similar to different psychometric models for the simultaneous estimation of response accuracy and response times. A B-GLIRT model for response times that corresponds to the model proposed by Thissen [25] with an additional time discrimination parameter is
with ρ1 as the slope parameter for the regression of (log-) response time on the latent ability variable θp [see [1], for the derivation of the cross-link function]. We will refer to this model as the B-GLIRT regression model.
A second model can be specified using the following form of the cross-link function:
The model in Equation (4) is equivalent to the model suggested by van der Linden [23] as the hierarchical model, extended by the slope parameter φi for the time discrimination. The parameter ρ1 can be interpreted as correlation, depending on the constraint used to identify the factor model. We will refer to this model as the B-GLIRT hierarchical model.
A third model, which is to some extent equivalent to a between-subject version of the model suggested by Partchev and De Boeck [26], can be specified by adding an interaction term in the cross-relation function as follows:
In this model, the parameter ρ1 corresponds to the linear regression coefficient, while ρ2 is the regression coefficient for the latent interaction term τpθp. We will refer to this model as the B-GLIRT interaction model.
Item-Level Response Times
As we will describe in this section, time differences between subsequent responses were used to derive comparable item-level response times for PBA and CBA. The main idea that allows extracting time measures from PBA and CBA is to focus on time between responses while taking into account the order of responses. For instance, a proxy for the item-level response time for a question “Q2” (the second question of a hypothetical test) is the time difference between the responses to question “Q2” and “Q1” if both questions are answered consecutively. When all questions in a booklet are answered in a strictly ascending order, time measures for all questions could be derived from the time difference between responses (besides the very first question “Q1”).
Reconstructing the Response Sequence Using States
Omitted responses and answers in non-ascending order have to be dealt with to obtain quantities that allow an interpretation as item-level response times measures in real data applications. The strategy described in this paper requires partitioning the whole testing time into segments, which start and end with the selection of answers in consecutive questions. The necessary theoretical justification for the treatment of the self-selected order of responses can be provided by a general framework that uses log data to distinguish meaningful states of the test-taking process [27]. In this framework, log events are processed algorithmically by reconstructing the sequence of states using, for instance, a finite state machine. Using this formal method allows implementing a procedure that can be applied to extract response times from the gathered raw log events that takes the response sequences and omitted responses as different “states” into account. The considered states correspond to sections of the test-taking processes that can be interpreted with respect to reading the text or answering a particular question.
Creating States Using Answer-Change Events Only
In the following, the theoretical framework will be applied to create meaningful sequences, by considering only so-called answer-change events (i.e., events that occur when the response to a task is changed). Figure 2 presents an example for three different state sequences for the first three questions of a test.
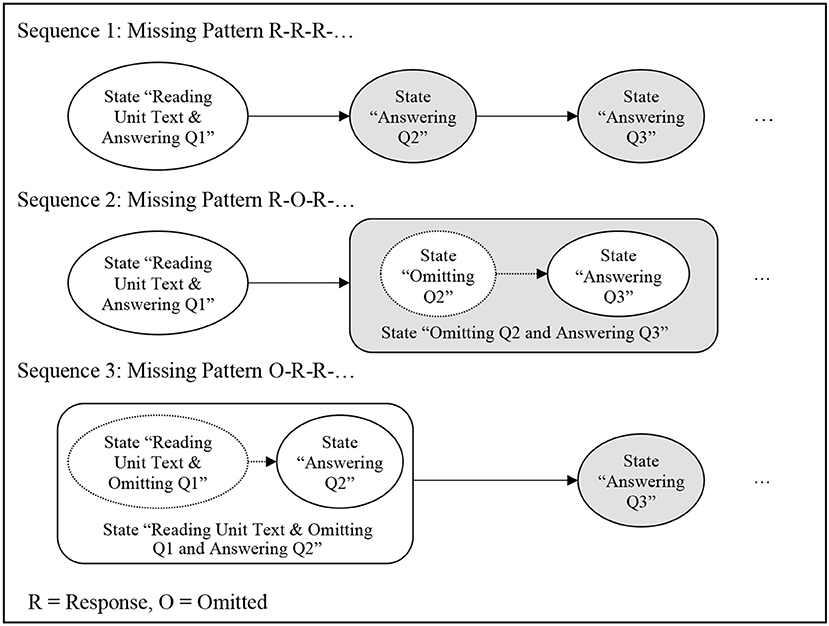
Figure 2. State sequences for the responses to the first 3 questions for 3 different missing response pattern.
For the first sequence with the response pattern “R-R-R-…” (i.e., a response R is given for the first three items, and no response is missing), the first answer-change event is used to separate the state “Reading Unit Text & Answering Q1” from the state “Answering Q2.” Since it is impossible to extract from the time differences between responses, at which point a test-taker exactly started a unit, no item-level time measure can be extracted for the very first question in this approach. However, when the second question is answered, the time between the first and the second response can be counted as time component for question Q2.
The second pattern illustrates the effect of an omitted item. In this sequence with the pattern “R-O-R-…” (i.e., the second item was omitted, O), the first answer-change event separates the states “Reading Unit Text & Answering Q1” from the state “Omitting Q2 and Answering Q3.” According to the nature of missing responses, no time measure for the two states “Omitting Q2” and “Answering Q3” can be extracted, because the two underlying states collapse into the state “Omitting Q2 and Answering Q3” due to the missing answer-change event for question Q2. Hence, it depends on additional reasoning whether and how the time measure for this collapsed state “Omitting Q2 and Answering Q3” should be used. For sequences with more than one omitted response (e.g., R-O-O-R, not included in Figure 1), the structure of the problem remains identical: the time differences between two answer-change events do not allow to identify states with a clear meaning if states collapse due to omitted responses. As we will show later, sequences with collapsed states resulting from the process of omitting one or multiple (further) questions can either be ignored (option “strict”) or counted as time components for the first questions after the omission (option “liberal”).
The third sequence in Figure 1 illustrates the missing value pattern “O-R-R-…” (i.e., the first question is omitted). In this situation, the observed answer-change event can be used to identify the transition from the state “Reading Unit Text & Omitting Q1 and Answering Q2” and the state “Answering Q3.” Even though no item-level response time for the collapsed state “Reading Unit Text & Omitting Q1 and Answering Q2” is available, the time between the responses to question Q2 and question Q3 allows extracting an item-level response time for question Q3 with a clear interpretation. Note that all sequences start in the state “Reading Unit Text & Answering Q1” because the reading text was shown on the first page(s) of the CBA instrument and the reading text was printed on the first page(s) of the PBA booklet, respectively. The use of the finite state machine approach for analyzing log data assumes that the test-taking process can be described as a progression of states that corresponds to one question at a time, starting with the reading text and the first question for each unit. By starting the finite state machine used to reconstruct the sequence of states for each test-taker in the state “Reading Unit Text & Answering Q1,” knowledge about the CBA and PBA instrument is included in the analysis using the finite state machine approach introduced in [27].
Defining the Interpretation of Time Measures Using Bigrams
To generalize from the sequences shown in Figure 2 to all possible sequences, we consider subsequences of length two (i.e., pairs of subsequent answers). Subsequences can be described using the terminology of n-grams of all potential sub-sequences. Pairs of subsequent answers create n-grams of size 2, labeled as bigrams. The bigrams Q1-Q2 and Q2-Q3, for instance, correspond to the sequence one as shown in Figure 2. Item-level response times can be extracted using bigrams with the finite state machine approach, in which the time between responses is counted as time component for the second part of each bigram. That is, the time difference between the observed responses in the bigram Q1-Q2 is used as time component counting for the item-level response time for question Q2.
The representation of subsequences as bigrams created from the reconstructed sequence of states points to the different options for the handling of omitted responses and non-ascending response orders. If no additional navigation-related log data are incorporated (i.e., if only time differences between responses are used that create answer-change events)1, an assumption is required for a “liberal” treatment, namely the assumption that the time between two responses can always be counted for the question which was answered last. Time measures for collapsed states can also be derived under this assumption (e.g., the item-level response time for omitting question Q2 and answering question Q3 after question Q1, see the second sequence in Figure 2). However, depending on the frequency of omitted responses, time measures for collapsed states (i.e., bigrams resulting from omitted responses or jumps to previous questions), that occur only rarely in an empirical application might not be possible to include in a psychometric model due to data sparseness. Therefore, we consider the following two options to deal with bigrams that represent either omitted responses (such as Q1-Q3) or non-ascending self-selected response orders (such as Q3-Q1):
• Option 1 (Strict): Only time measures of adjacent tasks are extracted, using missing values for response times when questions are omitted, or answers are given in a self-selected, non-ascending order for a particular test-taker. Item-level response times extracted in this strict way have the clearest interpretation but are only available for a subset of responses. They cannot be computed for responses that are given next to an omitted response and they are missing for questions answered in non-ascending order.
• Option 2 (Liberal): Time measures for all bigrams are extracted and interpreted regardless of the previous response. For each bigram of two responses, the time difference between the two responses is counted as time component for the second response of the bigram, regardless whether the two responses represented in the bigram are direct neighbors or any pair of questions, answered one after the other. This option results in item-level response times that always contain the true response times, but also additional time for omitting one or multiple responses. Accordingly, more noise is absorbed into the response time measures using option 2.
Accordingly, the following interpretations of item-level response times are possible for the exemplary sequences with omissions in Figure 2. For the second sequence, only the bigram Q1-Q3 is observed because Q2 is omitted. The time between the response to the first question Q1 and the response to the third question Q3 could be interpreted as time measure for the third response Q3 (option “liberal”). Alternatively, the time measure could be modeled separately or excluded from the analysis, as such a time measure is only available from persons showing this particular pattern (omitting Q2). For the third sequence, only the bigram Q2-Q3 can be observed in the data, because Q1 was omitted. Accordingly, no time measure for Q1 can be extracted for persons showing such a pattern. In summary, the derivation of item-level response times can be described as follows: The test-taking process is segmented into states based on the answer-change events. The treatment of the time measure for a particular state is derived from the bigram of two subsequent states. A liberal option to extract item-level response times ignores the first state in the bigram, a strict option creates time measures for identical bigrams only, resulting in more missing values.
Cumulating Response Times for Multiple Answer-Changes
In the empirical application, the within-unit navigation was neither restricted in CBA nor PBA2. Accordingly, any bigram, for instance, Q2-Q3, could occur multiple times if answers to question Q2 and Q3 were selected and changed again. Hence, the item-level response times had to be aggregated within test-takers before using them in the psychometric model. Aggregating response times over multiple exact identical bigrams (option 1) is only expected for a small number of cases. In contrast, for option 2, item-level response times from all bigrams that end with a particular question are aggregated to derive total item-level response times for a particular question. In both options, the response times are cumulated.
Hypotheses
A linear cross-relation function in the B-GLIRT model seems plausible for ability tests if higher underlying abilities are related to faster responses (i.e., if working more fluently and faster reflects higher ability level). Spending more time on a particular task may also indicate a more careful work on the task, predicting a linear relationship in the opposite direction. From the “time on task” literature (e.g., [28]) it was derived that the linear relationship between speed and ability should be negative for reading items. However, it is known from previous research that the time on task effect increases with increasing ability level [28]. Hence, it is expected that for a linear cross-relation function the correlation is negative (H1a) and that a speed-ability interaction, as modeled in the interaction term τpθp of the cross-relation function f(.) in Equation (5), can be found (H1b). Regarding the two different options to operationalize response times at the item level, we have no specific hypothesis, i.e., we investigate the robustness of the findings regarding both options for hypothesis H1a and H1b.
We expected to replicate gender differences for reading ability that were repeatedly found in previous research [e.g., [12]] in CBA (H2a) and PBA (H2b). However, we did not expect different response processes between boys and girls, i.e., equal parameters of the cross-relation function are expected for boys and girls, again for CBA (H3a) as well as for PBA (H3b), when the model takes ability and speed differences into account.
Analyzing PBA and CBA together, we also expected equal parameters of the cross-relation function for both modes (H4), after taking inter-individual differences in the accuracy mode effect into account which were found in previous research [Kroehne et al. (submitted)].
To provide empirical evidence regarding the validity of the extracted item-level response times (a) and the response times collected using digital pens (b), we disentangled the analyses of gender and mode effects. After selecting the parameterization fitting best for the cross-relation function we first analyzed data for CBA concerning gender effects. Subsequently, we repeated the analyses of gender effects using PBA data aiming at similar patterns and, in particular, equal parameters of the cross-relation function. Based on these analyses we proceeded by analyzing CBA and PBA simultaneously concerning mode effects.
Method
Instruments
Items measuring reading comprehension investigated in this study were taken from the PISA 2009 reading assessment [18]. Two intact clusters with non-overlapping items had been selected and computerized with the CBA-ItemBuilder [29]. The two clusters comprised five polytomously scored items with multiple score categories and 32 dichotomously scored items (eight units in total). Polytomously scored items were dichotomized in this study by merging full credits and partial credits. Kroehne et al. (submitted) presents a detailed description of various properties of the test administration that constituted the assessment in both modes. Specifically, PBA was conducted with digital pens [for technical details see [13]] allowing to record time stamps and digital traces of strokes that provide the basis for the comparison of response processes as indicated by response times.
Sample
In this study, 856 students (aged from 15.33 to 16.33, M = 15.82, SD = 0.29) were assessed (48.67% female). The subset of students was sampled randomly from the sample of German PISA 2012 main study schools and none of the sampled schools were excluded due to technical problems. The sample contained 33.9% students from the academic track, 15.89% were immigrants in the first or second generation, and 8.86% reported that German is not their language at home.
Design
An experimental design with random assignment of test-takers to modes was implemented. A between-subject design was supplemented by an additional within-subject component to investigate construct-related changes and cross-mode correlations. For that purpose, a subset of 440 test-takers answered reading items in CBA and PBA (i.e., one cluster in each mode). Those students had to change the administration mode (i.e., switching between modes in the middle of the testing session was implemented). The sequence of modes (CBA-PBA and PBA-CBA) was balanced between the 440 test-takers to avoid confounding of mode and position effects. None of the test-takers answered both clusters in the identical mode. Consequently, the 416 test-takers in the between-subject part of the design which were administered only one cluster in one mode had missing values by design for all units of the other cluster. In both modes the reading assessment was administered self-paced with a time limit at the cluster level and only the mode was randomly assigned, while the speed for reading texts and answering tasks was self-selected.
Data Analysis
As described above, item-level response times were extracted from the CBA log data and the digital traces of strokes gathered with digital pens using time differences between responses only and further prepared using the strict and the liberal option as described above. Specifically, we operationalized the time of an answer-change event comparable between both modes as the point in time when the last response-related action to a particular question was observed (mouse click for complex and simple multiple-choice items or typing for text response in the CBA mode; last XY-coordinate event of a stroke in the PBA mode). Focusing on the last response-related action results in time measures that absorb the answering time itself (i.e., the time that was required to write, type, or select an answer).
The log-transformed response times were used in latent variable models for the speed factor, after trimming item-level time measures by recoding response times that were larger than 300 s3 as missing values. Time measures for the response to the first question in each cluster were not included in the mode due to data sparseness (i.e., the models were built using up to 30 responses and up to 28 response times for each test-taker).
B-GLIRT models were estimated in Mplus 7.4 [30] using dichotomous indicators of the item responses for the ability factor. Multi-group structural equation models with latent interaction term were estimated using the MLR estimator and the Knownclass-option of Mplus. Example inputs for the different models are provided in the digital supplement.
Absolute model fit measures were not available for this estimation of the B-GLIRT models. Therefore, the analyses were based on the assumption that the ability part fit the particular IRT model in each mode (see Kroehne et al. (submitted), for a detailed investigation of mode effects in the responses, ignoring response times). For the B-GLIRT models, which also contain a speed part, the information criteria AIC and BIC were used for relative model comparisons. As discussed by Vrieze [31], the choice between AIC and BIC depends on the researchers' notion of the true model and the assumption whether the true model is one of the candidate models. Hence, the selection of AIC or BIC also reflects the result of weighing efficiency (i.e., finding the model that minimizes the mean squared error of prediction; AIC) against consistency (i.e., finding asymptotically the true model, if it is one of the candidate models; BIC).
In the first step of the analysis we aim at finding the best fitting parametrization of the cross-relation function. For this comparison we do not necessarily expect that the true model is part of the candidate models, so we prefer the AIC. The set of investigated parameterizations of the cross-relation function is chosen as the models that fit into the framework of the B-GLIRT models and that were used in previous research to investigate the relationship of speed and ability. However, we formulate a particular hypothesis specifically for one of the possible parameterizations (H1a).
In the second step, we investigate measurement invariance of the response and speed parts of the B-GLIRT model with the best fitting parameterization of the cross-link function selected in the first step, regarding gender groups. In order to find the degree of measurement invariance, we compare model fit criteria between different restrictive models starting with an unconstraint multi-group model as a baseline model. Technically we follow Millsap and Yun-Tein [32] using a stepwise procedure to find the best fitting model by constraining (1) slope parameters, (2) intercept parameters, and (3) residual variances across groups. Doing so we include constraints on measurement parameters and relaxed constraints about the equality of latent variables variances and means. For this comparison we prefer AIC for the same reasons as in the first step, but we also report BIC to allow an independent evaluation of the model comparisons.
Mplus code to fit the described models can be found in the digital Appendix.
Results
Descriptive summaries of the variability of response time and correctness of responses across items are provided in Figure 3 and Figure 4. The (log-) response time (upper part) for the 28 responses and the proportion correct (lower part) for the 30 items are plotted in Figure 3 for males and females and in Figure 4 for PBA and CBA. The descriptive plots in Figure 3 suggest systematic gender differences, especially for response times. For a multitude of items, systematic differences in the response times can also be supposed for the mode comparison presented in Figure 4.
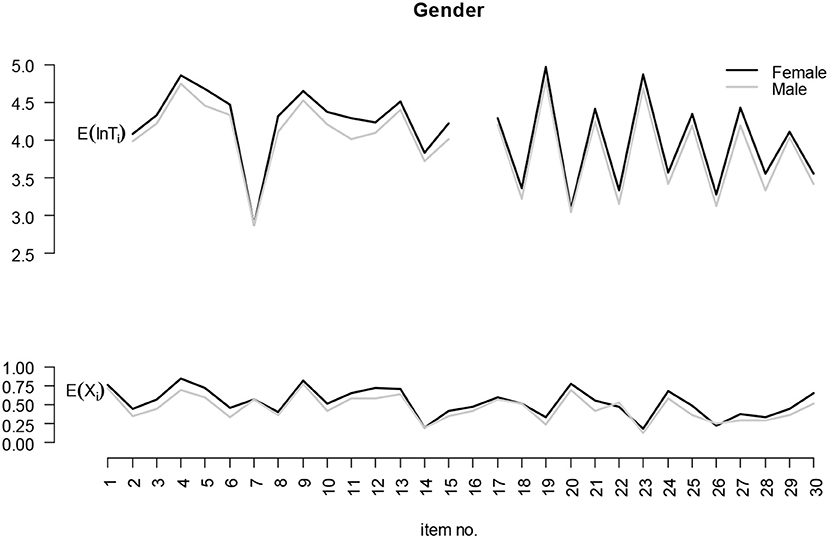
Figure 3. Gender differences with respect to the log-response time and the proportion correct responses.
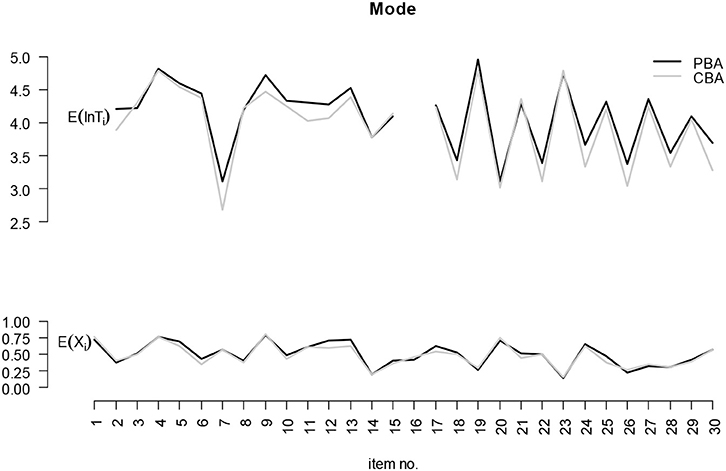
Figure 4. Mode differences with respect to the log-response time and the proportion correct responses.
Table 1 contains the information criteria for selecting the best-fitting parameterization for the cross-relation function of the B-GLIRT models. Consistent for both modes (PBA vs. CBA) and both options of aggregating item-level response times (strict vs. liberal), the cross-link function of the B-GLIRT interaction model that corresponds to Partchev et al. [26], including an interaction between ability and speed parameter, was the best fitting model according to the AIC (and BIC) criterion.
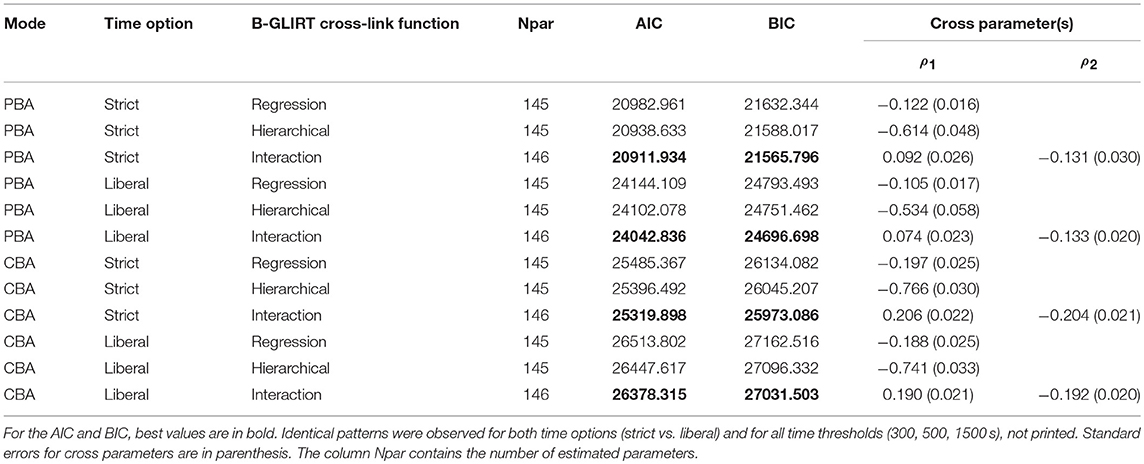
Table 1. Information criteria for the model comparison (different parameterizations of the cross-relation).
Table 1 also presents the estimated parameters (with standard errors in parenthesis) for all considered parameterizations of the cross-relation function. For a linear relationship between speed and ability (i.e., the parameter of the B-GLIRT hierarchical model), we found the expected negative relationship (confirming hypothesis H1a). Note that the negative relationship is found to be slightly stronger for CBA (e.g., −0.614 for the strict option for PBA compared to −0.766 for PBA). However, as the B-GLIRT interaction model provides the better model fit for PBA and CBA regarding AIC (and BIC, confirming H1b), all further analyses will be based on the parameterization of the cross-relation function for the B-GLIRT interaction model as shown in Equation (5).
The observed patterns of regression coefficients are identical for the two investigated options to aggregate response time measures to item-level time measures (strict vs. liberal). Accordingly, all subsequent models are based on the more liberal option 2 as slightly smaller standard errors are observed for this option with fewer missing time measures. It should be acknowledged that the estimated regression coefficients are small overall with only minor differences between modes (PBA vs. CBA): 0.074 (0.023) vs. 0.190 (0.021) for ρ1 and −0.133 (0.020) vs. −0.192 (0.020) for ρ2.
The results of the second analysis step, the investigation of measurement invariance of parameters estimated in the B-GLIRT interaction model for gender and mode, are reported in the next two subsections.
Gender
Table 2 presents the information criteria for the investigation of measurement invariance between gender groups for data gathered in the CBA mode using the B-GLIRT interaction model. Model comparisons with respect to the information criteria are conducted relative to a baseline model with 293 estimated parameters which were allowed to vary freely between groups (Model C1). The model comparisons are grouped into three sets of models: ability (successively constraining discrimination and difficulty parameters; Model C2-C7), speed (successively constraining time intensity and time discrimination parameters; Model C8-C16) and ability and speed (successively constraining all parameters; Model C17-C25). The AIC (and BIC) can be compared across the different model specifications and the model with the lowest information criterion will be selected and interpreted in this step of the analysis.
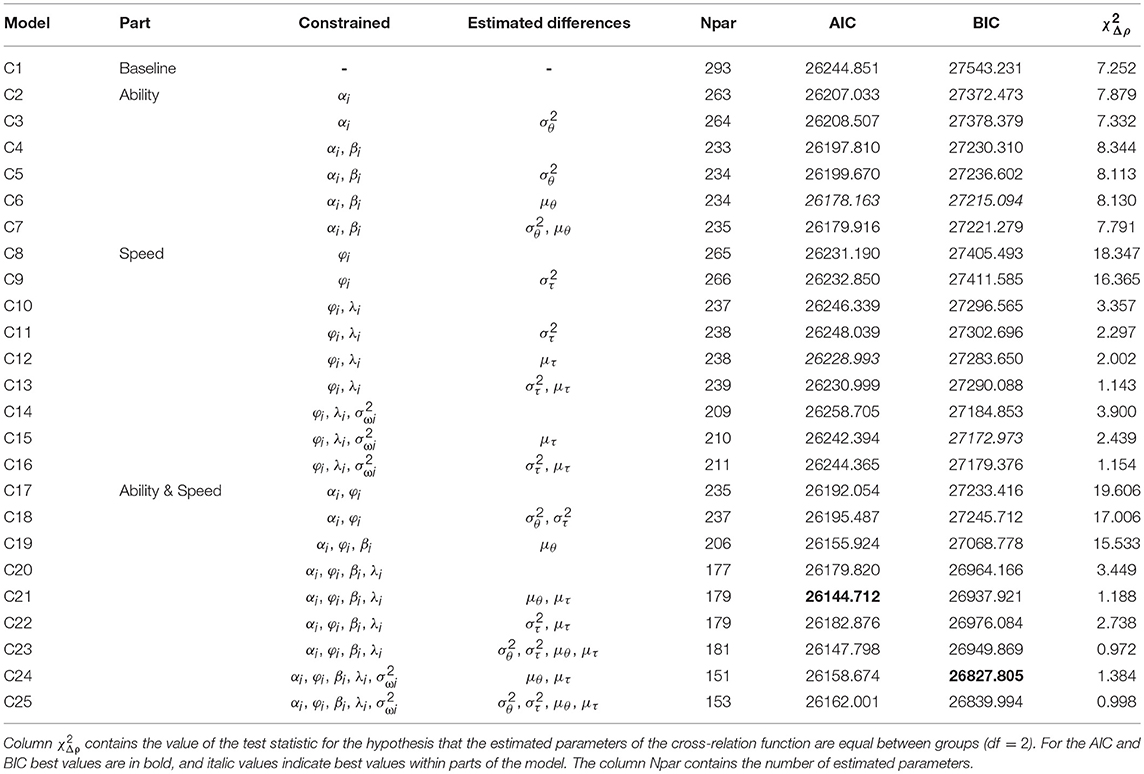
Table 2. Measurement invariance of the B-GLIRT model with linear interaction term in the cross-relation function with respect to gender for data from computer-based assessment.
Constraining loadings for the response model αi improved the model fit (Model C2). Relaxing the equality constraint of the latent variances for the ability factor θp (Model C3) decreased the fit slightly, indicating that there are no gender differences with respect to the ability variance. This pattern was also observed for the restriction of the intercept parameters βi in Model C4, which fits slightly better than the model with relaxed equality constraint on the latent variance (Model C5). The model fitting best for the response part in terms of AIC (and BIC) is Model C6, in which, in addition to Model C3, group differences in the latent mean of the ability factor θp are estimated (but different from Model C7 equal ability variances are specified).
Table 2 also informs about possible differences that can be estimated using a particular set of constraints. Using Model C6, the best fitting model in the set of models constraining parameters of the ability part (Model C2-C7), we estimated the expected ability differences to be 0.426 (0.092) between boys and girls (confirming H2a).
Model C8 to Model C16 add parameter constraints of the speed part of the B-GLIRT interaction model, starting with constraining the slope parameters φi, which resulted in a better model fit compared to the baseline Model C1. Similar to the ability part, we observed that allowing for group differences with respect to the variance of the latent speed factor τp consistently decreases model fit. AIC and BIC disagree with respect to the invariance of the intercept parameter λi for CBA. Constraining λi across groups resulted in an increased AIC (Model C8 vs. C10 and Model C9 vs. C11), while the BIC decreased. However, the best fitting model according to the AIC criterion in this set of models with constrained parameters of the speed part is model C12 (vs. Model C15 using BIC).
Corresponding to the observed ability differences, speed differences in CBA between boys and girls of 0.471/0.454 (0.134/0.130) were estimated using Model C12 and Model C15, respectively. However, interpreting these speed differences requires accepting invariance of time intensity parameters between groups, which is not supported based on the AIC criterion for the speed part of the B-GLIRT interaction model. Taking BIC as the criterion for simultaneously investigating speed and ability provides weak reasoning for assuming measurement invariance concerning the time intensity parameters λi (Model C20 or Models C15/C24). Moreover, the BIC also shows improved model fit for constraining the residual variances across groups (Model C24).
The last column of Table 2 shows the value of the χ2 statistic provided as Wald-test by Mplus, specified to test the hypothesis that the parameters ρ1 and ρ2 of the cross-relation function of the B-GLIRT interaction model are equal between groups (, with df = 2). The estimated parameters ρ1 and ρ2 involved in this Wald-test (see Table 3, upper part) from Model C12 and Model C15 did not differ statistically significant between boys and girls, as soon as time intensity parameters were assumed to be invariant. Note that the impact of the time discrimination parameter λi is a post-hoc explanation motivated by the observation that the smallest value of models with unconstrained time discrimination parameters (C2-C9; C17-C19) is 7.879, while the largest value of all models with constrained discrimination parameters (C10-C16; C20-C25) is 3.900. However, invariance is not supported by the AIC criterion, which was preferred by theoretical considerations. Accordingly, we only partially confirmed hypothesis H3a.
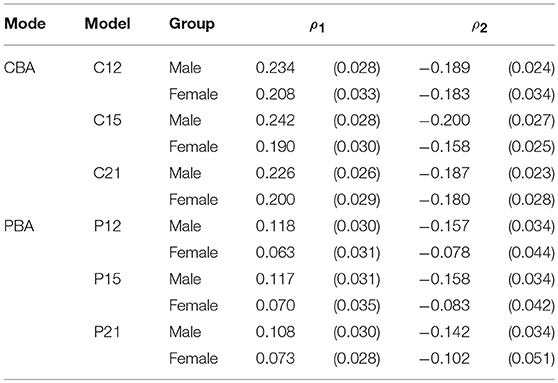
Table 3. Estimated parameters of the cross-relation function for the B-GLIRT interaction model.
We now describe the results for investigating measurement invariance of the B-GLIRT interaction model between gender groups for data gathered in the PBA mode.
Table 4 replicates the measurement invariance investigation for the data gathered in the paper-based test administration. Concerning the ability model, AIC and BIC favor the models with constrained slope and intercept parameters. The latent variance of the ability factor in the female group is estimated 0.758 (0.126) in Model P7 (the model with the lowest AIC value), but BIC slightly favors Model P6 which assumes equal latent ability variances between groups. However, we found full measurement invariance for the ability model in the PBA administration according to the AIC when the variance and the mean of the latent ability variable are freely estimated in the female group.
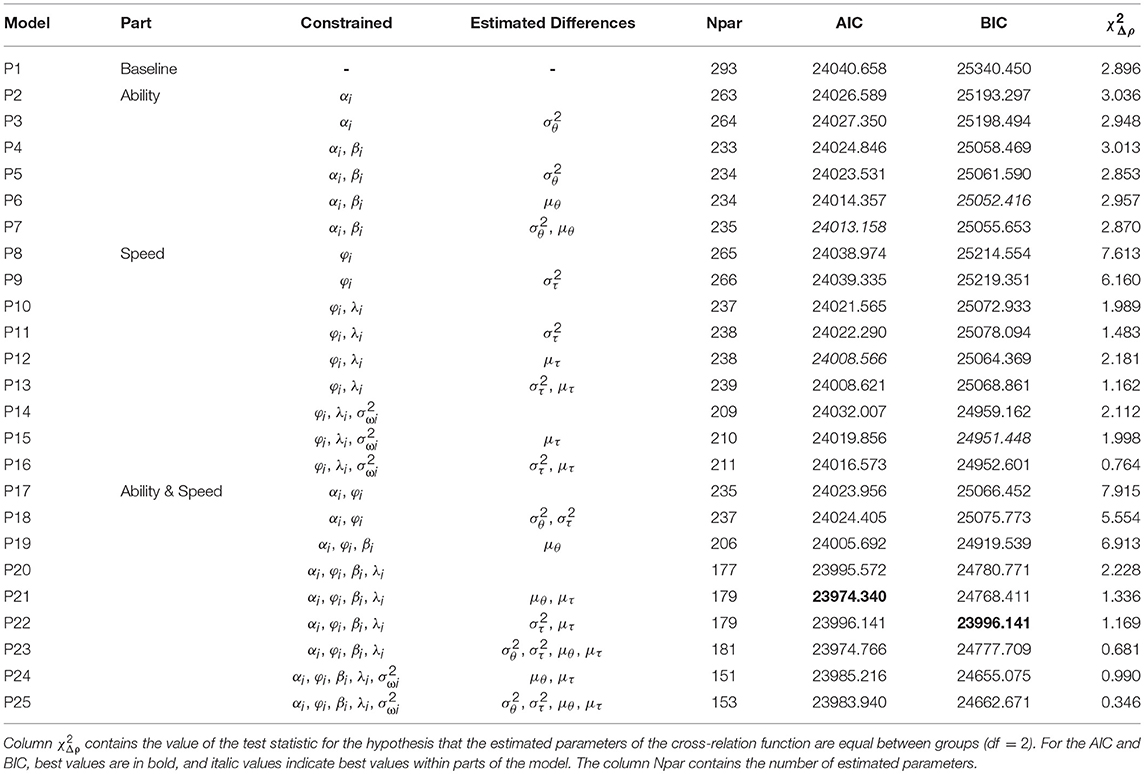
Table 4. Measurement invariance of the B-GLIRT model with linear interaction term in the cross-relation function with respect to gender for data from paper-based assessment.
Concerning the speed part of the B-GLIRT interaction model for the PBA data we observed a small improvement in model fit when constraining the slope parameters φi across groups (see Model P8 vs. Model P1 in Table 4) and a small additional improvement for constraining the time discrimination parameters λi (see Model P10 vs. Model P8). The best fitting model of the speed component for PBA in terms of AIC was achieved by acknowledging latent mean differences in the speed factor between gender groups, estimated as 0.426 (0.133) for PBA using Model P12. Constraining the residual variances across groups increased the AIC (i.e., measurement invariance with respect to the residual variances of the speed factor could not be achieved using the AIC as the criterion). Similar to the CBA data, taking BIC as the criterion would allow establishing measurement invariance with respect to the residuals (see Model P22 in Table 4)4.
Combining ability and speed for the PBA data resulted in the best fitting model regarding AIC when αi, φi, βi, and λi are constrained across groups (Model P21/Model P23 in Table 4). However, measurement invariance with respect to the residual variances was neither achieved using AIC nor BIC. Speed and ability differences estimated using Model P21 were 0.316 (0.099) and 0.405 (0.161) demonstrating that girls have a higher ability (confirming H2b) while taking more time to respond in PBA. However, as the last column in Table 4 reveals, the estimated parameters of the cross-relation function ρ1 and ρ2 did not differ statistically significantly between boys and girls (see Table 3, lower part, for the estimated values of ρ1 and ρ2), confirming H3b. Moreover, Table 3 contains the descriptive result that the coefficients ρ1 for the linear main effect of θp and ρ2 for the interaction τpθp are smaller for PBA compared to CBA, estimated in separate B-GLIRT interaction models for both modes.
Mode
In the following, we report the results for investigating measurement invariance regarding mode. For these analyses we examined the data for boys and girls together, without grouping by gender. In order to test the equality of the cross-relation parameters of the B-GLIRT interaction model between modes, we considered a combined model for CBA and PBA simultaneously (see Figure 5 for a schematic path diagram). Due to the within-subject component of the experimental design, a single group structural equation model with indicators for PBA and CBA items can be specified.
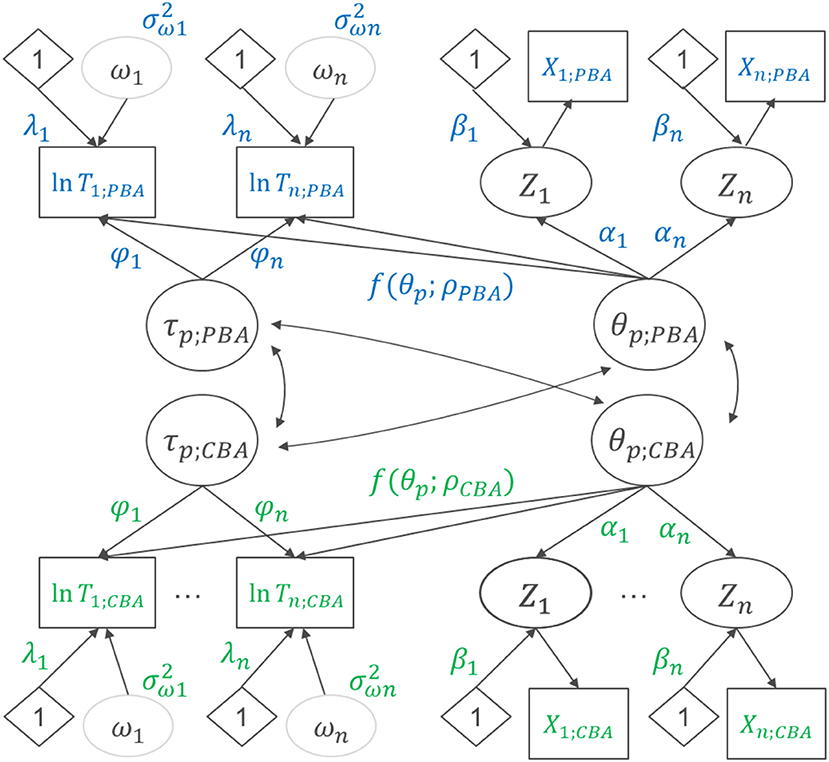
Figure 5. B-GLIRT model for responses and response times gathered in a within-subject design with planned missing values in paper-based and computer-based assessment.
Measurement invariance as investigated for the comparison of groups regarding the person-level variable “gender” is not strictly necessary when modeling mode effects since the mode effect can be identified making use of the randomized assignment of test-taker to CBA vs. PBA. To model the mode effect as a latent difference variable, we re-parameterized the model as a method effect model (e.g., [33]) within the B-GLIRT framework (see Figure 6)5. Doing so, we assumed measurement invariance concerning the ability part of the model by constraining αi and βi across modes. This allows identifying a latent difference variable θMode as the difference between θp; PBA and θp; CBA (included with equal loadings for each item administered in CBA mode, see Figure 6) and estimating the latent correlation between θp and θMode. The ability difference between modes is obtained as the mean of this latent difference variable θMode.
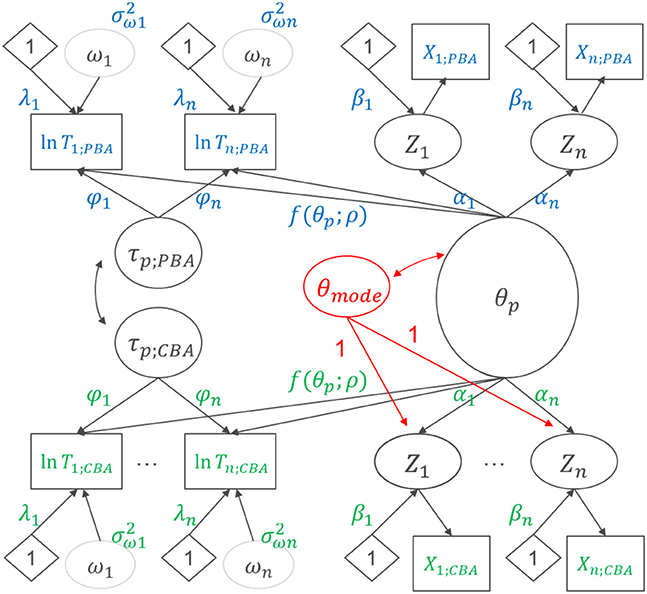
Figure 6. Re-parameterized B-GLIRT model with a latent difference variable for inter-individual differences in the mode-effect and correlated, mode-specific speed factor.
Starting with an unconstrained baseline model (Model M1) for the combined estimation of B-GLIRT interaction models for CBA and PBA data, Table 5 contains information criteria for the sequence of constrained models that allow to evaluate measurement invariance. As the comparison AIC reveals (see the ability part in Table 5) a model with equal item difficulty parameters and equal item discrimination parameters (Model M3) fits the data almost equally well-compared to mode-specific item difficulties (Model M2) or mode-specific item parameters (Model M1).
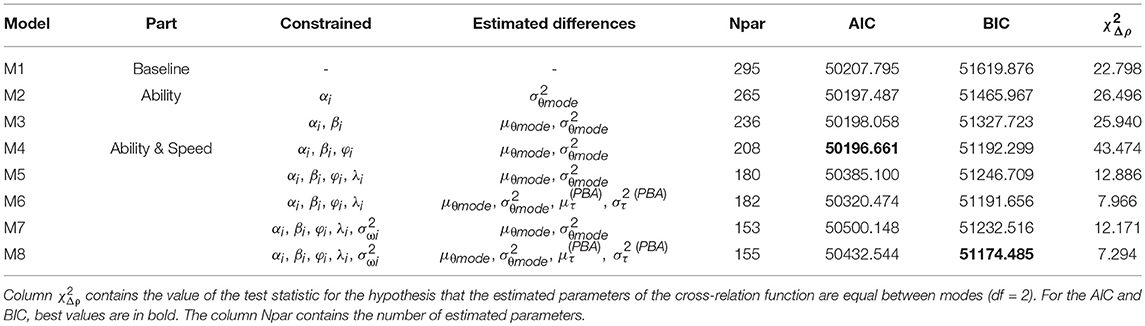
Table 5. Measurement invariance of the B-GLIRT model with linear interaction term in the cross-relation function between computer-based and paper-based assessment.
The lower part of Table 5 contains results from the combined estimation of B-GLIRT interaction models with constrained parameters of the measurement models for the latent speed factors (τp; PBA and τp; CBA) and the latent ability factors (θp; PBA and θp; CBA), which are re-parameterized as the latent ability factor (θp) and the latent difference variable (θmode). To ensure the necessary comparability concerning the measurement model of the speed factor for comparing ρ1 and ρ2 between CBA and PBA, we estimated a sequence of models with different equality constraints for φi and λi between modes (Model M4 to Model M8 in Table 5). While constraining φi (Model M4) led to an improved model fit in terms of AIC (and BIC), the fit declined, when time intensity parameters λi were constrained (Model M6 vs. Model M4), as indicated by an increased value of the AIC (and the BIC).
As Figure 7 shows, time intensity parameters estimated using Model M4 under the specification of zero and equal latent means for the speed factors τp, CBA and τp, PBA are slightly higher for PBA for most items (only 6 out of 28 time intensity parameters are smaller for PBA). Similar to the model specification used for the mode effect in the ability part of the B-GLIRT interaction model we simplified the mode effect for the time factor by constraining the differences in the time intensity parameter to a single parameter. Using an explicit identification based on an equality constraint of λi between modes, the parameter (i.e., the mean of the latent speed factor τp, PBA) was estimated in Model M6 as 0.561 (0.097), p < 0.05. A similar effect of 0.508 (0.089), p < 0.05, was estimated under the best fitting model in terms of BIC (Model M7). The mean of the speed factor τp, PBA corresponds to the mode effect with respect to speed, because the mean of the latent speed factor was constrained to zero for the CBA speed factor τp, CBA. Allowing the mean of the latent speed factor to vary between modes worsened the model fit in terms of AIC (and BIC), but strongly affected the estimated parameters in the cross-relation function. This is illustrated in the last column of Table 5. The χ2 statistics, provided as a Wald-test by Mplus for tests of the hypothesis that the parameters ρ1 and ρ2 of the cross-relation function differ between modes (), are highly sensitive to this part of the model (mis-) specification.
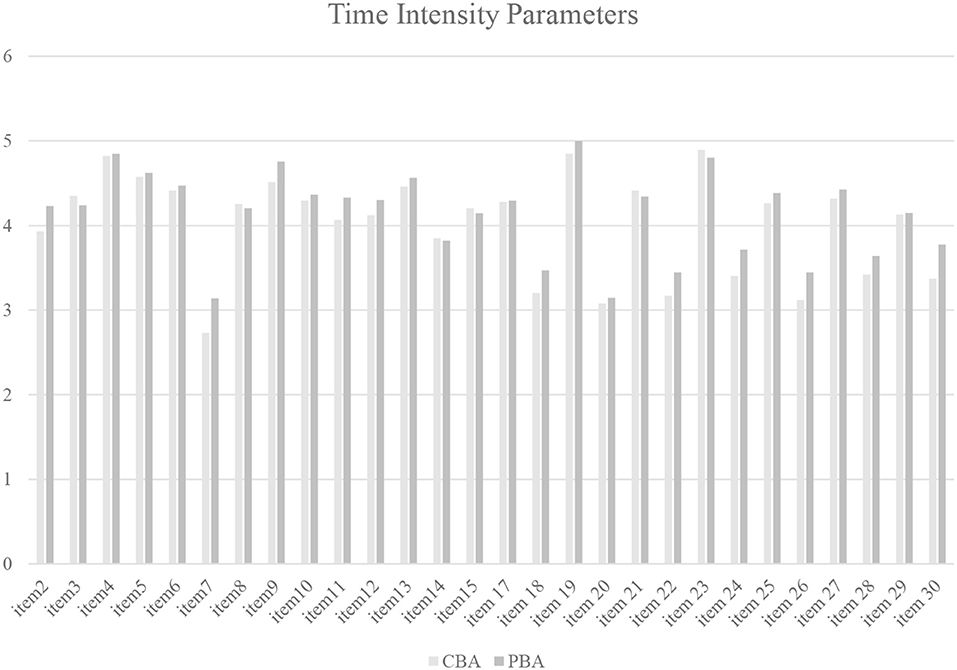
Figure 7. Estimated time intensity parameters for model M4 for the comparison of paper-based and computer-based assessment.
Finally, Table 6 shows the estimated parameters of the cross-relation function and the estimated mode effect parameters concerning speed and ability. In both models M6 and M8 the combined Wald-test for the constraint that the parameters ρ1 and ρ2 differ between CBA and PBA resulted in a χ2-value that indicates with df = 2 statistical significance. Inspecting the estimated values revealed that the difference is mainly due to the different interaction effect ρ2 between modes, rejecting H4. Moreover, we found that the latent speed factor τp, PBA has a variance different from 1 and a mean different from 0 (i.e., we found speed differences between modes). Test-takers tend to work slower in PBA and the speed factor has a smaller variance in PBA (i.e., test-takers are more similar with respect to speed in PBA compared to CBA). This completes the picture that is described with an ability mode effect: the latent mode effect variable θmode with an estimated mean μθ, mode different from 0 indicates an overall shift in the estimated ability (lower ability estimated from CBA). Inter-individual differences in the mode effect regarding the ability are modeled as latent difference variable. This latent difference variable is negatively correlated with reading ability, indicating a higher ability mode effect for test-takers with low reading abilities. Finally, we consistently found a moderate correlation between the latent speed factors for PBA and CBA across the different models. This moderate correlation indicates that responding in a particular speed to PBA administered reading units is only moderately related to the speed chosen to respond to CBA administered units in the self-paced assessment.
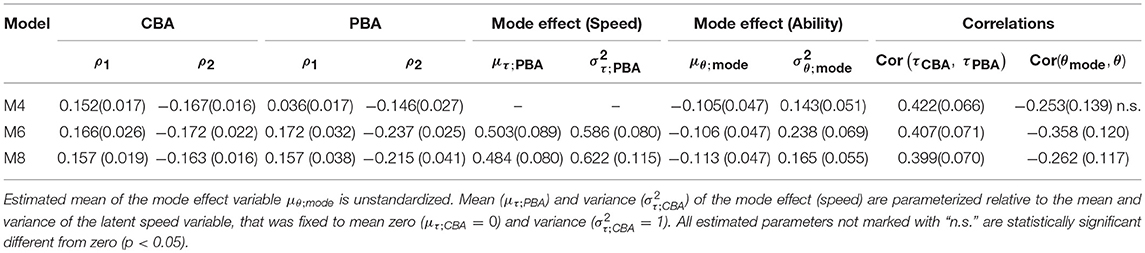
Table 6. Estimates of selected model parameters of the combined B-GLIRT interaction model for CBA and PBA data (see Figure 6).
Discussion
In this study, we applied psychometric modeling of response times gathered from CBA and PBA with digital pens for two selected clusters of PISA 2009 print reading assessment. For that purpose, we developed a method to derive comparable response times at item-level from log data that can be obtained from CBA and PBA (using digital pens). Subsequently, we used the time measures as indicators for the response speed in latent variable models and investigated differences in relationship of speed and ability across gender and mode. The analyses were grounded in the underlying idea that differences in the relationship between speed and ability could provide hints for actual differences in the true response process.
We found an overall negative correlation between speed and ability. The best relative fit was observed for a B-GLIRT interaction model, meaning a B-GLIRT model with a cross-relation function that included an interaction term between speed and ability in the regression of the (log-) response time on speed and ability. The regression coefficient for this interaction was estimated negatively for CBA and PBA. Using this specification of the cross-relation function in a multi-group analysis we found measurement invariance of the B-GLIRT interaction model between boys and girls concerning the slope and the intercept parameters of the speed and the ability part of the measurement model, but not concerning residual variances of the speed part of the measurement model. In line with previous research, we found ability differences between boys and girls. We also found that the gender differences in the reading ability coincide with speed differences between boys and girls for both modes (girls responded slower while tending to obtain higher scores than boys). Due to the nature of the study (only the mode was randomly assigned while the speed was self-selected) we can only assess that gender differences exist concerning speed and ability for PBA as well as for CBA. Using the available data, the specified Wald-tests for the comparison of the parameters in the cross-relation function between boys and girls showed no statistically significant difference in these parameters. Hence, our results give no reason to assume different response processes (as captured by the cross-relation function of the B-GLIRT model) for boys and girls so far.
Analyzing data for CBA and PBA together allowed investigating mode effects with respect to speed (in addition to the typical investigated comparability of ability estimates or item parameters). Resting on the invariance assumptions of time discrimination parameters estimated from PBA and CBA data, which was only supported by BIC, we found mean differences in speed in addition to mean differences in ability. Test-takers tend to answer items in PBA slower and more correctly in comparison to CBA. Moreover, we found hints that the relationship between speed and ability, modeled using the cross-relation function of the B-GLIRT model with an interaction term, differs between modes. However, the estimated regression coefficients for the interaction term are of small magnitude.
Our results reason further investigations of mode and gender differences in the response process and, in particular, a focus on the role of the self-selected speed component when changing the administration mode and when investigating gender differences in reading ability. However, as already investigated with this dataset Kroehne et al. (submitted) the mode effects found in the ability model give no reason to reject the hypothesis that CBA and PBA are construct-equivalent. Specifically, the latent correlation of PBA and CBA was not found to differ statistically significantly from the expected correlation of two test parts measuring the identical construct within one mode (for instance, PBA).
Limitations and Further Research
Up to the authors' knowledge, the current study is the first investigation of mode effects for self-paced assessments conducted under large-scale assessment conditions that includes a comparison of PISA reading assessments concerning response times. As the method to derive comparable item-level time measures for PBA and CBA was not previously available, the current study has some major limitations. For instance, the time measure for the first question of each cluster could not be derived in PBA, because no timestamp was available that indicated the start of the assessment. Future use of digital pens as an assessment device to collect log data from PBA might modify the assessment instrument by requesting the test-taker to draw a cross right before starting to read the reading text for the first unit in a booklet.
The conducted comparison of different parameterizations of the cross-link function within the framework of B-GLIRT models and the investigation of measurement invariance in parameters of the best fitting model is limited as both are based on the assumptions that the items fit the ability part and that the unconstrained combined model shows acceptable absolute model fit. An additional limitation regarding the applied modeling is that we restricted the complexity by investigating gender effects and mode effects separately in this study. Current literature (e.g., [34]) give reasons to assume an interplay between the mode and gender effect. Further research might focus on a multi-group model by gender with both modes. Due to the small sample size, estimation problems and the required estimation time, this has not been investigated yet. Moreover, as the latent interaction model is demanding on a computational level and the sample size is rather small, a replication of the finding that a cross-relation function including the interaction between speed and ability using different data would be beneficial.
Regarding the interpretation of the study results, a technical limitation is that we have not computed any measures of effect size and practical significance. Moreover, the relationship of the speed differences with other covariates such as an ICT-related measure of basic computer skills is subject to additional investigations. Also, since we did not control for the answering time as the time to give the response (writing vs. typing), the observed response time differences between modes might be caused by the mechanical process of “answering.”
Conceptually, the role of speed as a potential mediating variable of mode effects is open for further research, for instance, by analyzing mode and gender differences within subgroups of test-takers with comparable (self-selected) speed. In the current form, the study is limited to the descriptive finding that ability differences coexist together with speed differences.
The validity of the reported results regarding the response time models rest on the operationalization of item-level response times applied in this paper. The chosen approach was mainly driven by the desire to create time measures that give insights into the comparison of the response process between modes. However, only limited validity evidence exists regarding the interpretation of the time measures derived from paper-based assessments using digital pens. More detailed analyses are needed, for instance, comparing item-level response time measures derived using different operationalization using all available log data for CBA.
Ethics Statement
The data collection was carried out with permission of the Centre for International Student Assessment (ZIB) as national add-on study to PISA 2012. As per OECD guidelines and German national regulations (KMK) no new ethics approval was required.
Author Contributions
The paper uses data gathered in a national extension study of the Centre for International Student Assessment (ZIB) to PISA 2012. CH computerized the reading units using the CBA ItemBuilder and coordinated the data collection and the preparation of raw data. The authors jointly developed the study design. UK was responsible for the integration of the CBA instrument and coordinated data collection using digital pens for the paper-based assessment. UK developed the strategy for analyzing log data from digital pens and conducted the statistical analyses. UK wrote the first draft of the manuscript and FG and CH reviewed the draft and contributed to the final manuscript.
Funding
This work was funded by the Open Access Fund of the Leibniz Association.
Conflict of Interest Statement
The authors declare that the research was conducted in the absence of any commercial or financial relationships that could be construed as a potential conflict of interest.
Acknowledgments
This study was previously presented at the annual meeting of the National Council on Measurement in Education (NCME) 2018 in New York. The authors would like to thank Katie McClarty, the discussant of the session Diving into Data with Response Process Research as well as Cordula Artelt from the Leibniz Institute for Educational Progress (LIfBi) for their helpful feedback.
Supplementary Material
The Supplementary Material for this article can be found online at: https://www.frontiersin.org/articles/10.3389/fams.2019.00002/full#supplementary-material
Footnotes
1. ^In this paper we focus on possibilities that are applicable to log data gathered in PBA and CBA, ignoring approaches that use, for instance, navigation-related paradata or other information that indicate, how long a page with an omitted task was visible on a computer screen.
2. ^Note that the between-unit navigation was not restricted in PBA (i.e., students were able to go back to a previous unit within the booklet), but between-unit navigation was not possible in the CBA implementation. As discussed, for instance, by Kroehne and Martens [8] the different possibilities to navigation between units could contribute to the differences between modes.
3. ^The value of 300 s was selected as a threshold to remove outliers without any further theoretical justification.
4. ^Measurement invariance with respect to the residual variances of the speed model is not required for a valid interpretation of gender differences.
5. ^The symmetrical reformulation of the speed model was avoided taking into account that, although first evidence was provided regarding the comparability of time measures, the time indicators Ti; PBA and Ti; CBA were created using completely different log data.
References
1. Molenaar D, Tuerlinckx F, van der Maas HLJ. A bivariate generalized linear item response theory modeling framework to the analysis of responses and response times. Multivar. Behav. Res. (2015) 50:56–74. doi: 10.1080/00273171.2014.962684
2. Goldhammer F, Kroehne U. Controlling individuals' time spent on task in speeded performance measures: experimental time limits, posterior time limits, and response time Modeling. Appl. Psychol. Measure. (2014a) 38:255–67. doi: 10.1177/0146621613517164
3. Goldhammer F. Measuring ability, speed, or both? Challenges, psychometric solutions, and what can be gained from experimental control. Measure. Interdiscipl. Res. Perspect. (2015) 13:133–64. doi: 10.1080/15366367.2015.1100020
4. Molenaar D. The value of response times in item response modeling. Measure. Interdiscipl. Res. Perspect. (2015) 13:177–81. doi: 10.1080/15366367.2015.1105073
5. Li Z, Banerjee J, Zumbo BD. Response time data as validity evidence: has it lived up to its promise and, if not, what would it take to do so. In: Zumbo BD, Hubley AM, editor. Understanding and Investigating Response Processes in Validation Research. Cham: Springer International Publishing (2017). p. 159–177.
6. Kyllonen P, Zu J. Use of response time for measuring cognitive ability. J. Intellig. (2016) 4:14. doi: 10.3390/jintelligence4040014
7. Goldhammer F, Klein Entink RH. Speed of reasoning and its relation to reasoning ability. Intelligence (2011) 39:108–19. doi: 10.1016/j.intell.2011.02.001<
8. Kroehne U, Martens T. Computer-based competence tests in the national educational panel study: The challenge of mode effects. Zeitschrift für Erziehungswissenschaft (2011) 14:169–86. doi: 10.1007/s11618-011-0185-4
9. Schroeders U, Wilhelm O. Equivalence of reading and listening comprehension across test media. Edu. Psychol. Measure. (2011) 71:849–69. doi: 10.1177/0013164410391468
10. Grover RK, Ercikan K. For which boys and which girls are reading assessment items biased against? Detection of differential item functioning in heterogeneous gender populations. Appl. Measure. Edu. (2017) 30:178–95. doi: 10.1080/08957347.2017.1316276
11. Marks GN. Accounting for the gender gaps in student performance in reading and mathematics: evidence from 31 countries. Oxford Rev. Edu. (2008) 34:89–109. doi: 10.1080/03054980701565279
12. Lynn R, Mikk J. Sex differences in reading achievement. Trames J. Humanit. Soc. Sci. (2009) 13:3. doi: 10.3176/tr.2009.1.01
13. Dirk J, Kratzsch GK, Prindle JP, Kroehne U, Goldhammer F, Schmiedek F. Paper-based assessment of the effects of aging on response time: a diffusion model analysis. J. Intellig. (2017) 5:12. doi: 10.3390/jintelligence5020012
14. Kong Y, Seo YS, Zhai L. Comparison of reading performance on screen and on paper: a meta-analysis. Comp. Edu. (2018) 123:138–49. doi: 10.1016/j.compedu.2018.05.005
15. Mangen A, Walgermo BR, Brønnick K. Reading linear texts on paper versus computer screen: Effects on reading comprehension. Int. J. Edu. Res. (2013) 58:61–8. doi: 10.1016/j.ijer.2012.12.002
16. Schwabe F, McElvany N, Trendtel M. The school age gender gap in reading achievement: examining the influences of item format and intrinsic reading motivation. Read. Res. Q. (2015) 50:219–32. doi: 10.1002/rrq.92
17. Bouchamma Y, Poulin V, Ruel C. Impact of reading strategy use on girls' and boys' achievement. Read. Psychol. (2014) 35:312–31. doi: 10.1080/02702711.2012.724043
18. OECD. PISA 2015 Results (Volume I): Excellence and Equity in Education. Paris: OECD Publishing (2016). Available online at: http://dx.doi.org/10.1787/9789264266490-en
19. Jerrim J, Micklewright J, Heine JH, Salzer C, McKeown C. PISA 2015: How Big Is the ‘Mode Effect’ and What Has Been Done About It? Oxford Review of Education (2018). doi: 10.1080/03054985.2018.1430025
20. Robitzsch A, Luedtke O, Koeller O, Kroehne U, Goldhammer F, Heine JH. Herausforderungen bei der Schätzung von Trends in Schulleistungsstudien [Challenges in estimations of trends in large-scale assessments: a calibration of the German PISA data]. Diagnostica (2016) 63:148–65. doi: 10.1026/0012-1924/a000177
21. Drasgow F. (ed.). Technology and Testing: Improving Educational and Psychological Measurement. New York, NY: Routledge (2016).
22. Hecht M, Siegle T, Weirich S. A model for the estimation of testlet response time to optimize test assembly in paper-and-pencil large-scale assessments. J. Edu. Res. Online (2017) 9:32.
23. van der Linden WJ. A hierarchical framework for modeling speed and accuracy on test items. Psychometrika (2007) 72:287–308. doi: 10.1007/s11336-006-1478-z
24. Fox J-P, Marianti S. Joint modeling of ability and differential speed using responses and response times. Multivar. Behav. Res. (2016) 51:1–14. doi: 10.1080/00273171.2016.1171128
25. Thissen D. Timed testing: an approach using item response testing. In: Weiss DJ, editor. New Horizons in Testing: Latent Trait Theory and Computerized Adaptive Testing. New York, NY: Academic Press (1983). p. 179–203.
26. Partchev I, De Boeck P. Can fast and slow intelligence be differentiated? Intelligence (2012) 40:23–32. doi: 10.1016/j.intell.2011.11.002
27. Kroehne U, Goldhammer F. How to conceptualize, represent, and analyze log data from technology-based assessments? A generic framework and an application to questionnaire items. Behaviormetrika (2018) 45: 527–63. doi: 10.1007/s41237-018-0063-y
28. Goldhammer F, Naumann J, Stelter A, Tóth K, Rölke H, Klieme E. The time on task effect in reading and problem solving is moderated by task difficulty and skill: Insights from a computer-based large-scale assessment. J. Edu. Psychol. (2014b) 106:608–26. doi: 10.1037/a0034716
29. Roelke H. The ItemBuilder: a graphical authoring system for complex item development. Presented at the World Conference on E-Learning in Corporate, Government, Healthcare, and Higher Education (2012). p. 344–53.
30. Muthén LK, Muthén BO. Mplus Version 7.4 [Computer software]. Los Angeles, CA: Muthén & Muthén (2015).
31. Vrieze SI. Model selection and psychological theory: a discussion of the differences between the Akaike information criterion (AIC) and the Bayesian information criterion (BIC). Psychol. Methods (2012) 17:228–43. doi: 10.1037/a0027127
32. Millsap RE, Yun-Tein J. Assessing factorial invariance in ordered-categorical measures. Multivar. Behav. Res. (2004) 39:479–515. doi: 10.1207/S15327906MBR3903_4
33. Pohl S, Steyer R. Modeling common traits and method effects in multitrait-multimethod analysis. Multivar. Behav. Res. (2010) 45:45–72. doi: 10.1080/00273170903504729
Keywords: reading ability, computer-based assessment, mode-effects, response times, log data, paper-based assessment
Citation: Kroehne U, Hahnel C and Goldhammer F (2019) Invariance of the Response Processes Between Gender and Modes in an Assessment of Reading. Front. Appl. Math. Stat. 5:2. doi: 10.3389/fams.2019.00002
Received: 31 August 2018; Accepted: 14 January 2019;
Published: 18 February 2019.
Edited by:
Qiwei He, Educational Testing Service, United StatesReviewed by:
Minjeong Jeon, University of California, Los Angeles, United StatesCarol Eckerly, Educational Testing Service, United States
Copyright © 2019 Kroehne, Hahnel and Goldhammer. This is an open-access article distributed under the terms of the Creative Commons Attribution License (CC BY). The use, distribution or reproduction in other forums is permitted, provided the original author(s) and the copyright owner(s) are credited and that the original publication in this journal is cited, in accordance with accepted academic practice. No use, distribution or reproduction is permitted which does not comply with these terms.
*Correspondence: Ulf Kroehne, kroehne@dipf.de